Showing posts with label graphing. Show all posts

Friday, October 15, 2010

A Graphing Extension


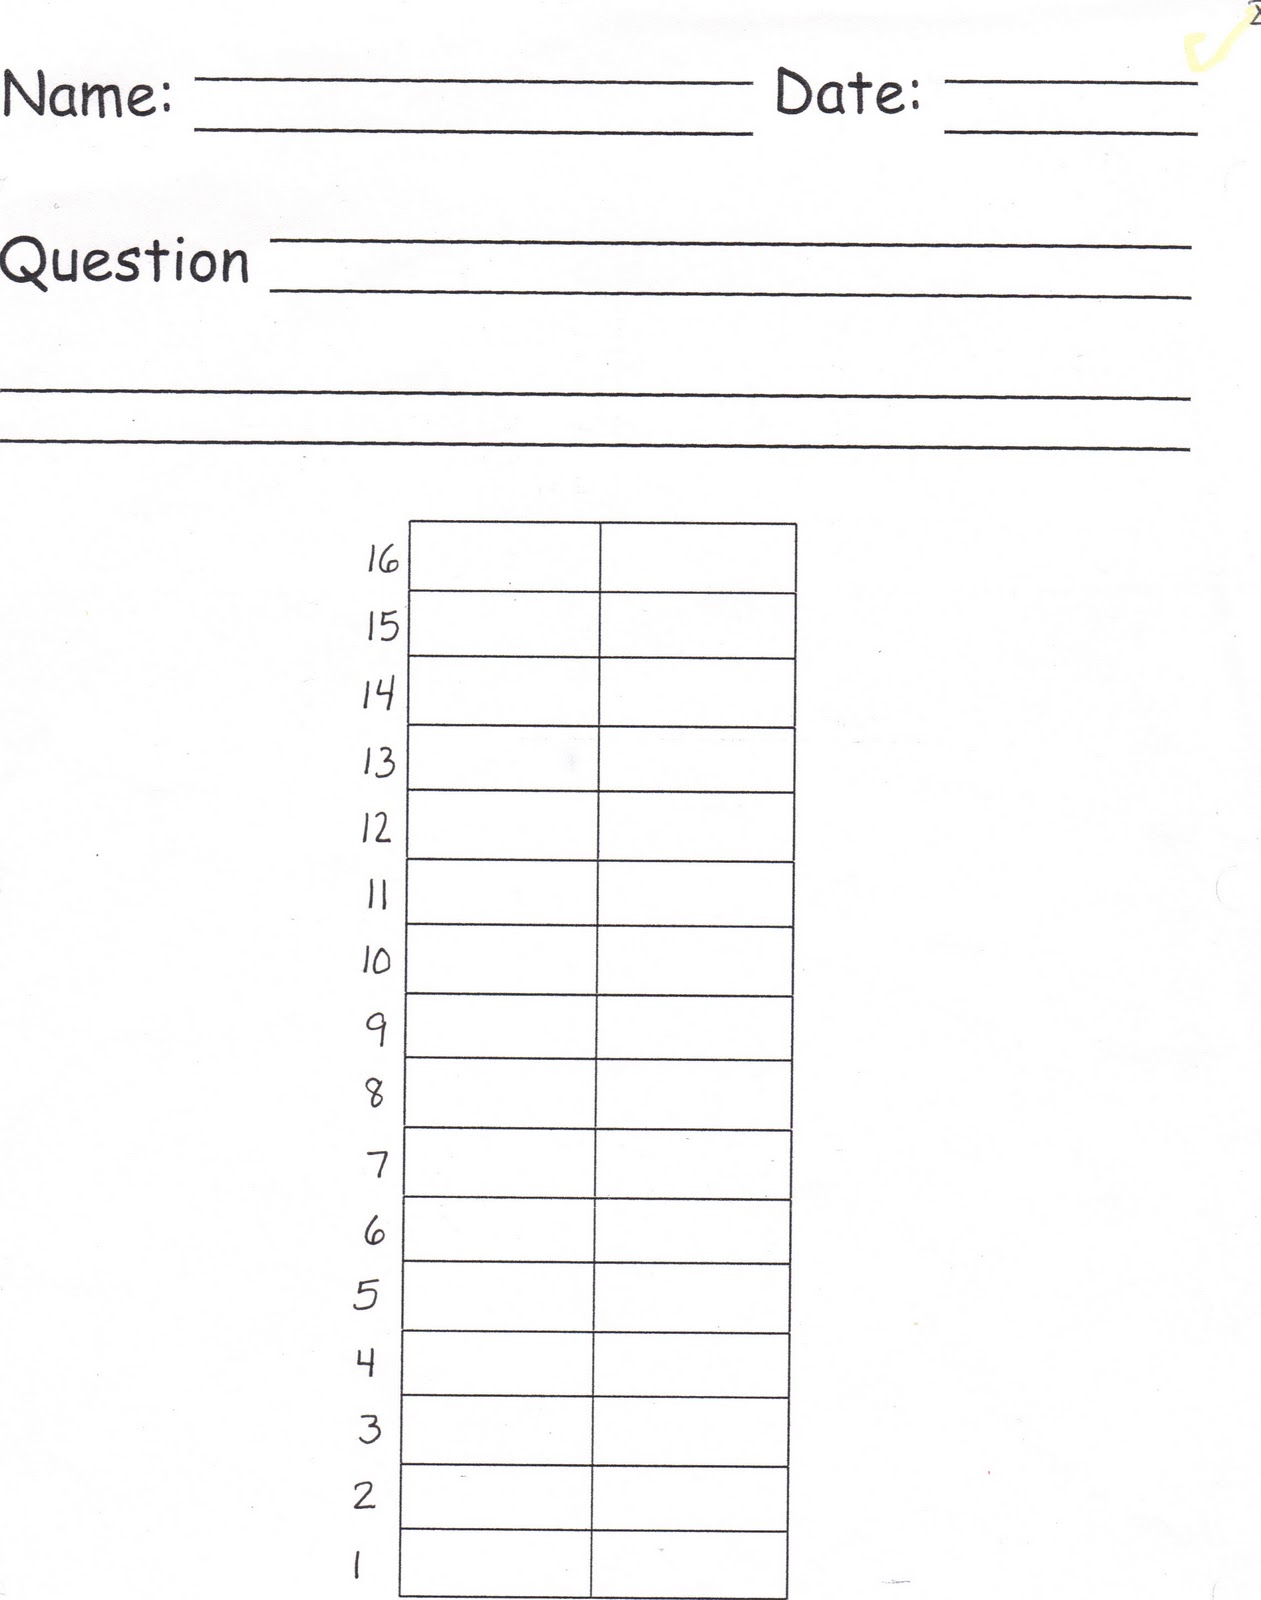
If these are the conclusions, can you figure out what this graph looks like? 

Today I decided to try a little problem-solving extension with the class... an extra assessment of sorts, I suppose.  Even though all of the children have demonstrated their abilities to create surveys and bar graphs, drawing conclusions from the data, I know that our students don't always do well on the data and graphing sections of our state tests.  When we, teachers, looked at these questions recently, it was quite clear that an even higher level of thinking is required.  Students are asked to match data with a graph or infer conclusions, so it occured to me that I might ask my students to work backwards from conclusion to graph instead of from graph to conclusions.  I wrote up a set of conclusions for an imaginary graph and asked my first and second graders to make me the graph. 

Most students made this graph without too much difficulty:


Those that had trouble, clearly had different reasons for it, which can be seen in their work. 

This student simply colored the wrong number of blocks:
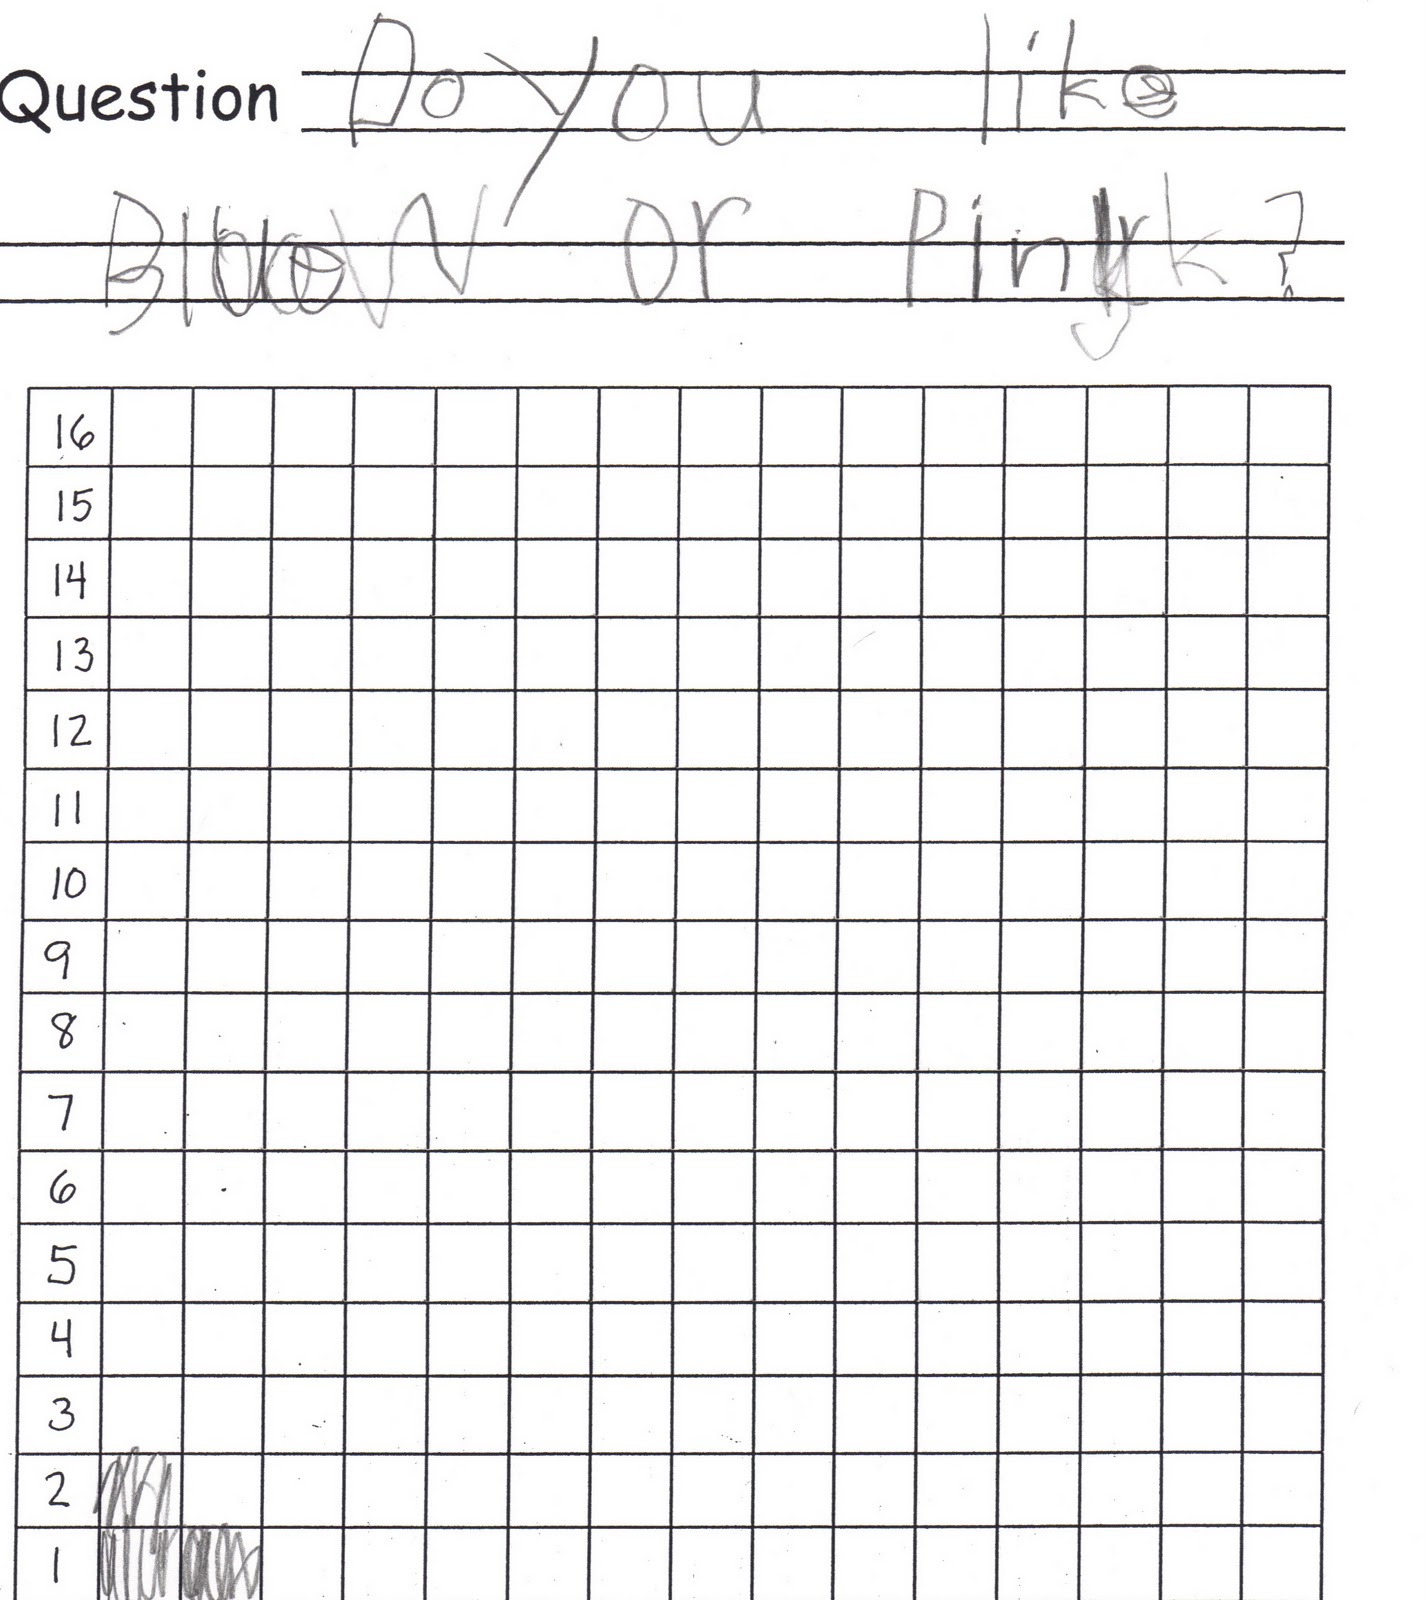

This student misunderstood the task and invented a similar graph to the one indicated.  (His reads "Do you like pink or purple?"):

And this child couldn't figure out what the question might have been, writing "I think pink.  Pink was less?"  He did know to color in two blocks pink, but randomly guessed a larger number of blue blocks. 

Was this task differentiated?  No.  Maybe next time I'll try to create a few more of these tasks with a range of difficulty.  Students could work on more difficult challenges after finishing simpler ones. 

Some other ideas I have for imaginary conclusions:

--Less people wanted to be a goose.
--Most people had 6.
--1 more person liked red than green.
--Equal numbers of people chose dogs and cats. 
--Everyone liked it.
--More people liked red.  3 people liked red.  2 less people liked green.


Thursday, October 14, 2010

Graphing Assessment

I've been referring to our math time these past few weeks as "graphing workshop," and I've been thinking of it as very much akin to our "writing workshop."  If you are familiar with Lucy Calkins' Writing Workshop model, you'll understand how in order to assess students' learning, I decided to collect an "edited" and "published" piece of graphing work from each.  Lucy uses the phrase "fix up and fancy up" when she introduces the idea of publication to young children.  I found myself using the same phrasing today, telling the class that they would be choosing one of the graphs they had created over the past few weeks to "fix up and fancy up."  I modelled how I might do this and shared a checklist for top quality work:  neat, periods and question marks, upper and lowercase letters, vowels, at least one conclusion for first graders and at least three conclusions for second graders.  Students spent the period copying over their graphs, fixing up the writing, and adding new conclusions before mounting them on large construction paper to be hung in the hallway.

Wednesday, October 13, 2010

Line Plots


Our second graders are supposed to learn about line plots, while first graders are simply supposed to master bar graphs.  Today's mini-lesson introduced the idea of the line plot to the whole group-- a graph where the choices are numbers.  I modelled this by surveying students about how many teeth they had lost.  Creating line plots were then required of second graders and offered as a choice for first graders during our ongoing graphing workshop. 

Tuesday, October 12, 2010

Multiple Choice Graphing


Up until now we've been asking questions with two choices--Would you rather do this OR this?  Would you rather have this or that?  Today we made graphs where survey respondants were given more than one choice-- which is your favorite color:  red, orange, yellow, green, blue, or purple?  The conclusions drawn from these graphs include many more possibilities-- for example, more people like red than yellow, but fewer people like red than blue.  After modelling this for students and creating one together, we continued with our graphing workshop and those who were ready to start a new graph created one with multiple choices. 

Monday, October 11, 2010

Sideways Graphing


Blocks can be stacked vertically.  They can also be stacked horizontally.  So can bar graphs.  Today we continued to develop survey questions, collect data in the form of a bar graph, and write down conclusions drawn from the data, but instead of working vertically, we turned our graphs sideways. 

Where's the differentiation here?  I've been a bit concerned about that all this past week.  Today I'm worrying less because I could see all of the kids busily engaged in their work.  When a task isn't appropriate, I usually have off-task behavior.  When a task is suitable for everyone, everyone stays focused.  This is a somewhat open-ended task, which allows students to set their own pace and the writing about conclusions can be done at a number of different levels. 

Friday, October 8, 2010

Drawing Conclusions

Not only do students need to be able to make a graph, they need to be able to look at a graph and draw conclusions from it.  Today we looked at graphs we'd made previously and practiced talking and writing about the results.  First we looked at some of the big graphs we'd made on chart paper and we discussed them using vocabulary cards reading "most," "least," "greater," "more," "less," "fewer," and "altogether." I modelled recording some of our conclusions on chart paper.  Then I gave each child back the graph they'd made yesterday along with a paper headed with the prompt: "From my graph I learned that..."  These were stapeled onto the graphs before being turned in.  As students finished, they came to show me.  We reviewed their work together and I marked it with one smiley face for every sentence they wrote.  This motivated a number of students to go back and write more conclusions before declaring their work "finished."   After handing in the completed graph and conclusion sheet, they were allowed to go on to develop a new survey and graph. 

Thursday, October 7, 2010

Bar Graphs

Yet another step towards abstraction with graphing-- today we moved from picto-graphs to graphs made of blocks to bar graphs on paper.  Telling the kids that I'd like to make graphs faster than we did yesterday when everyone had to draw pictures, I handed each child an inch-cube to vote with, and we stacked up columns of cubes to answer survey questions.  We spent a good amount of time discussing which columns had more and less and the total numbers.  To speed up this process, I also modelled the idea of using a ruler marked off in inches to measure the height of the towers.  Then when we converted our graph to paper (because you can't keep a block graph set up permanently), we drew a "ruler" along the side for this same purpose.

And finally... the kids each made their own graphs.  They thought up a survey question, asked others, and recorded the results.

Wednesday, October 6, 2010

Real Graphs


Today we moved from Venn Diagrams into graphing.  I began again with the large masking tape Venn Diagram on the floor, telling students that we would sort ourselves once more and this time we would also count to see which category had more people in it.  I asked students to stand in circle A if they would rather be a tiger or in circle B if they would rather be a dolphin.  Because they had to choose which they would rather be, no one needed to stand in the "both" overlap.  Then I began to count how many kids were in each group and feigned difficulty, double counting and losing track as I went.  Since Venn Diagrams are great for sorting, but not so great for comparing numbers, I dramatized thinking of a better solution-- a graph.  So I ripped up the masking tape circles and created two masking tape lines, this time asking students to stand in one line if they would rather be a tiger and in the other if they would rather be a dolphin.  Again, I dramatized trying to count the groups, having a much easier time finding out that in this class, more people would rather be a dolphin.  

Just as we moved from the concrete to the abstract with "Not Boxes" and Venn Diagrams, I tried to move from concrete to abstract graphing in a series of small steps.  After making human graphs, we worked together to make a picto-graph with each child drawing a picture of the animal they would prefer to be-- this time, an eagle or a whale.