The first graders have done pretty well working independently. They have been focused and diligent in their work and for the most part, successful in solving the problems they've been given. This is a big improvement over years past, and I credit that to the fact that the worksheets they're working on are ones they can actually read. In the past, I've given them worksheets from the Scott Foresman-Addison Wesley math curriculum
Friday, October 22, 2010
Beginning Readers CAN Work Independently
Again, today, the first grade crew worked independently on combining story problems, while the second graders worked with me on missing addend combining stories.
The first graders have done pretty well working independently. They have been focused and diligent in their work and for the most part, successful in solving the problems they've been given. This is a big improvement over years past, and I credit that to the fact that the worksheets they're working on are ones they can actually read. In the past, I've given them worksheets from the Scott Foresman-Addison Wesley math curriculum . These are perfectly fine worksheets to do together with students, but are difficult for students to do independently because beginning of the year first-graders often can't read the stories. They are also often confused or distracted by the decorative edgings and little characters featured on the pages. Last year I tried using problems from the Read It! Draw It! Solve It!
 series which are geared specifically for beginning readers and I had a much better expereience with student independence. Since the kids clearly did better work when they knew exactly what the stories said, I wrote up my own set of worksheets with very simple stories and text using a very simple format. If I could figure out how to attach these documents here, I would, but I don't know a way to do that. If you'd like to have copies, email me at doingdifferentiatedmath@gmail.com and I will send them to you.
The first graders have done pretty well working independently. They have been focused and diligent in their work and for the most part, successful in solving the problems they've been given. This is a big improvement over years past, and I credit that to the fact that the worksheets they're working on are ones they can actually read. In the past, I've given them worksheets from the Scott Foresman-Addison Wesley math curriculum
Thursday, October 21, 2010
Extending Work on Combining Problems
For the past few days, I've really focused instruction on the first graders who are just beginning to work on addition stories. Now that they have a pretty solid grasp on what is expected of them when it comes to solving and recording a solution for a combining problem, I was able to assign this group independent work and focus my instructional efforts on the second graders who were ready to take things a little further.
The older group is totally fluent with basic combining stories (i.e. "There were 3 dogs. 2 more came. How many do are there now?") Today we worked with a more challenging vaersion of this kind of problem-- the missing addend combining story (i.e. "There were 3 dogs. Some more came. Now there are 5. How many more came?")
The older group is totally fluent with basic combining stories (i.e. "There were 3 dogs. 2 more came. How many do are there now?") Today we worked with a more challenging vaersion of this kind of problem-- the missing addend combining story (i.e. "There were 3 dogs. Some more came. Now there are 5. How many more came?")
Wednesday, October 20, 2010
More Write-Your-Own-Problems
More "Stay or Go" work today with addition combining stories. To keep the independent workers interested, I asked them to write their own combining problems related to "Make Way for Ducklings" which we've been reading together as a Big Book. Very sweet results: "There were 7 baby ducks and the mom and dad came back. How many ducks were there?" "Three ducks crossed the street. Then 5 more ducks crossed the street. How many ducks altogether?"
Tuesday, October 19, 2010
Write Your Own Combining Story
Much like yesterday we worked on addition combining stories using the "Stay or Go" format. Those who needed support worked with me on the rug; those who were ready to work independently worked at their table spots. For the independent workers, I have a row of sheets set up along a shelf to move through, but of course, some speed demons do finish all of these. To solve that problem, I added an open-ended worksheet at the end of the row on which students write and solve their own story problem. They can repeat this sheet with infinite variations and keep busy until the end of the period.
Monday, October 18, 2010
Introduction to Combining Problems
Today marks the start of a new unit focused on addition and subtraction concepts. We'll work with addition and subtraction story problems, not only working to come up with answers to questions, but also to relate appropriate number sentences to different types of situations. First graders will work primarily with combining and separating stories, while second graders will also work with comparing stories. In other words, we'll work with stories where I had some and got more and want to know how many I have now and stories where I had some, but lost some and want to know how many I have now. We'll also work with stories where I had some and got more or lost some and I'm wondering how many more I got or lost and stories where I had some and you had some and I'd like to know how many more one of us has compared to the other.
This is new material for the younger children, but familiar territory for the older children, although it has been a while since they've done this work, so a bit of review is called for. To keep everyone appropriately challenged, the unit is set up as a spiraling-scaffolded unit, making plenty of use of the "stay or go" format.
Here's how today's math period unfolded:
First, a mini-lesson in which we acted out story problems, solved them with cubes, recorded them on chart paper with pictures, words, and numbers. I modelled one, we did another together.
Then, those who were ready (i.e. my second grade crew) took worksheets to their table spots to complete independently, while those who needed more instruction (i.e. the first graders) set up worksheets with clipboards in the meeting area so that we could work together.
As the second graders finished their sheets, they moved on to others laid out along a shelf. When the first graders working with me finished our sheet, the math period ended.
Friday, October 15, 2010
A Graphing Extension

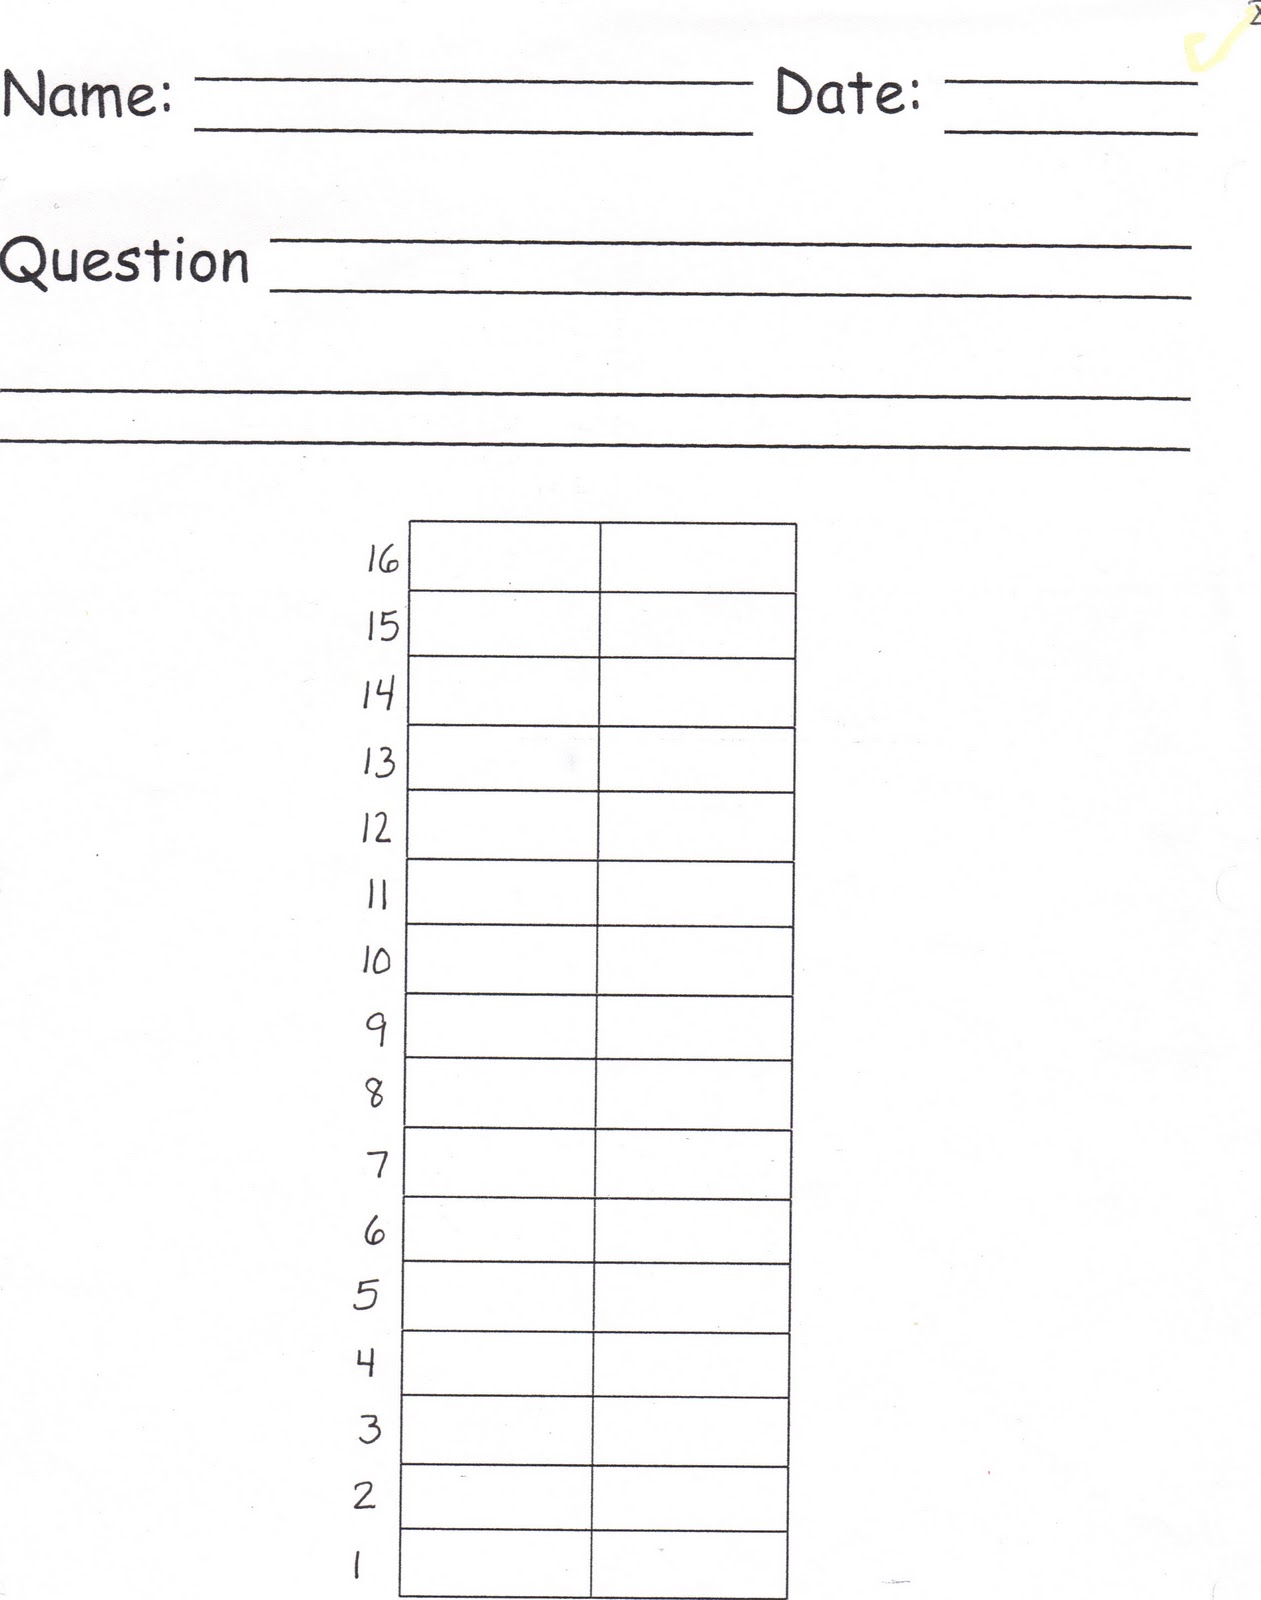
If these are the conclusions, can you figure out what this graph looks like?
Today I decided to try a little problem-solving extension with the class... an extra assessment of sorts, I suppose. Even though all of the children have demonstrated their abilities to create surveys and bar graphs, drawing conclusions from the data, I know that our students don't always do well on the data and graphing sections of our state tests. When we, teachers, looked at these questions recently, it was quite clear that an even higher level of thinking is required. Students are asked to match data with a graph or infer conclusions, so it occured to me that I might ask my students to work backwards from conclusion to graph instead of from graph to conclusions. I wrote up a set of conclusions for an imaginary graph and asked my first and second graders to make me the graph.
Most students made this graph without too much difficulty:

Those that had trouble, clearly had different reasons for it, which can be seen in their work.
This student simply colored the wrong number of blocks:
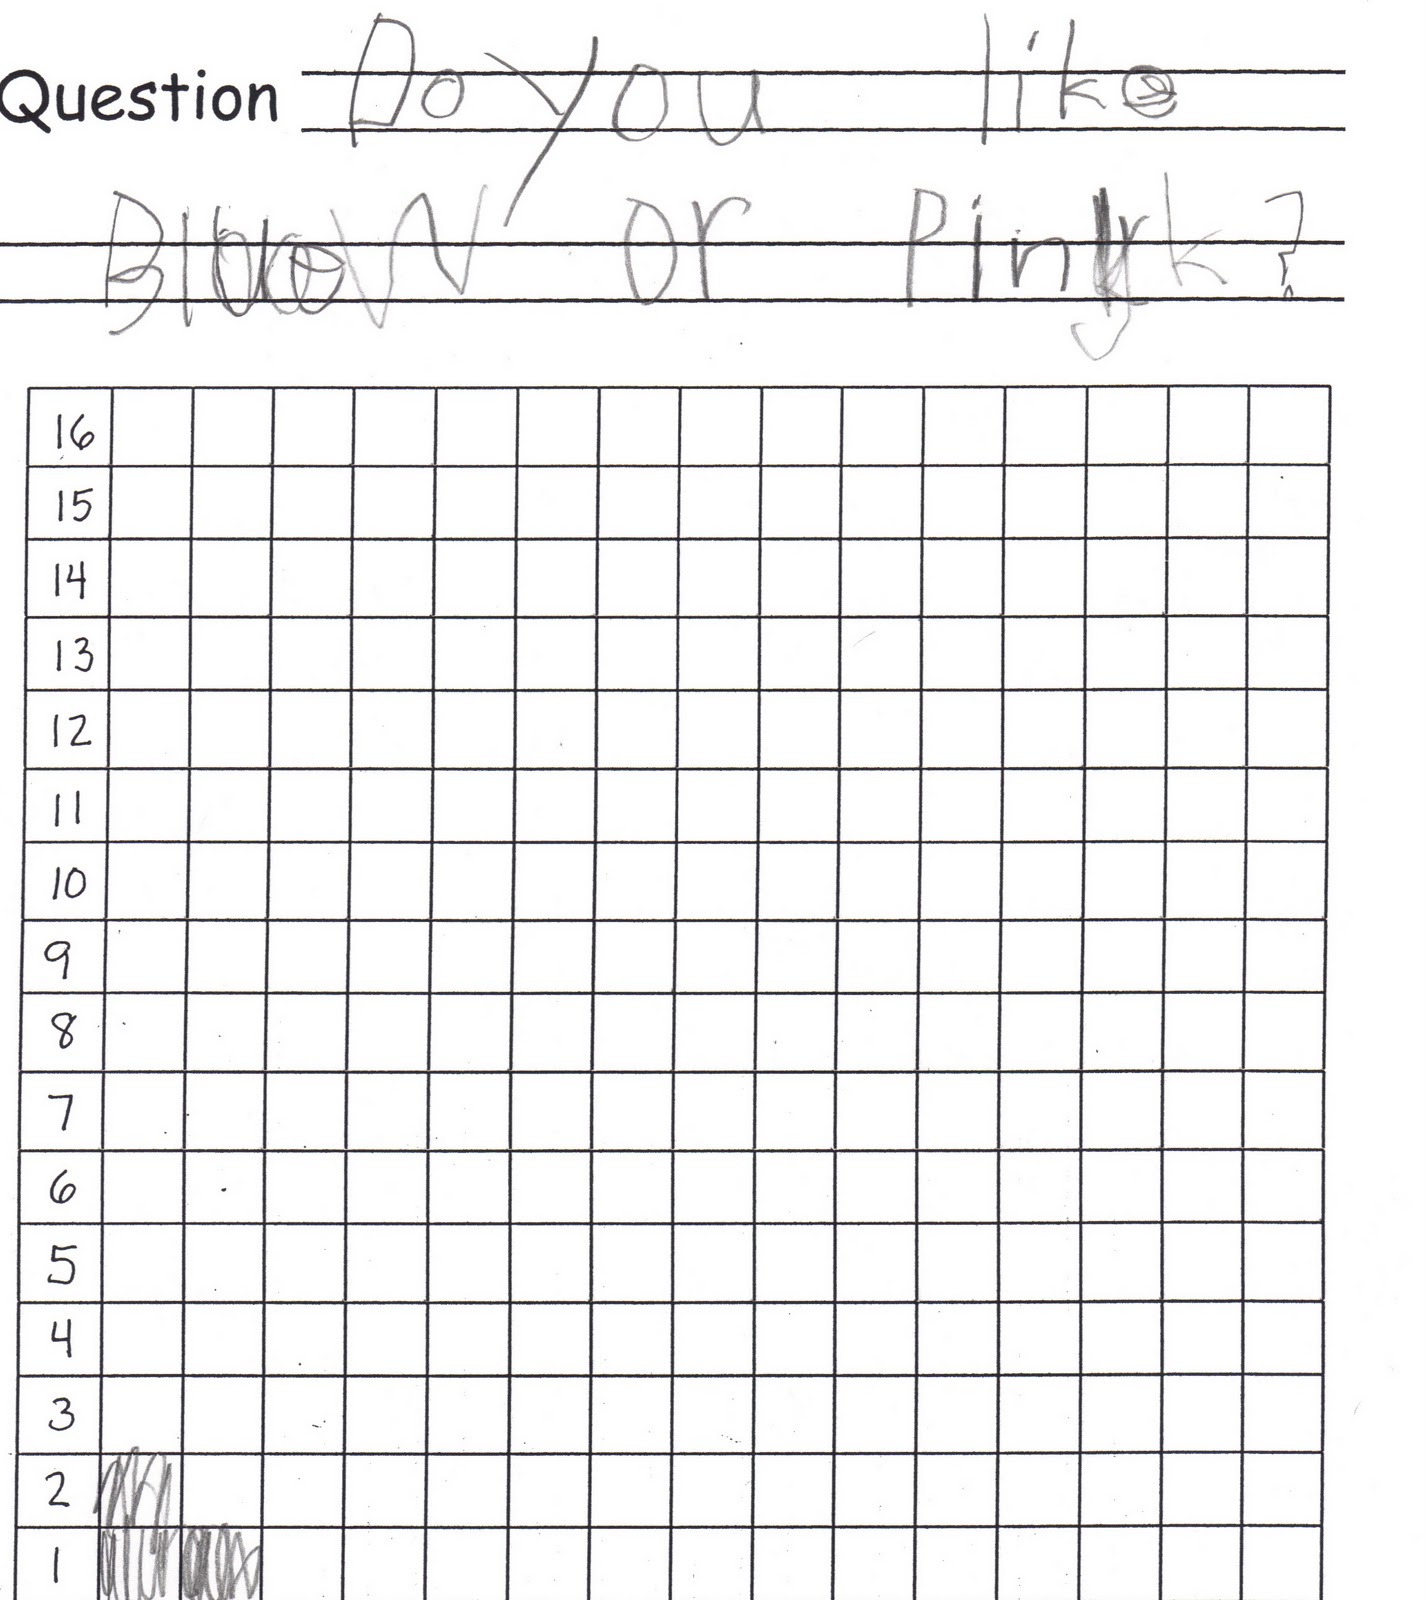
This student misunderstood the task and invented a similar graph to the one indicated. (His reads "Do you like pink or purple?"):


Was this task differentiated? No. Maybe next time I'll try to create a few more of these tasks with a range of difficulty. Students could work on more difficult challenges after finishing simpler ones.
Some other ideas I have for imaginary conclusions:
--Less people wanted to be a goose.
--Most people had 6.
--1 more person liked red than green.
--Equal numbers of people chose dogs and cats.
--Everyone liked it.
--More people liked red. 3 people liked red. 2 less people liked green.
Thursday, October 14, 2010
Graphing Assessment
I've been referring to our math time these past few weeks as "graphing workshop," and I've been thinking of it as very much akin to our "writing workshop." If you are familiar with Lucy Calkins' Writing Workshop model, you'll understand how in order to assess students' learning, I decided to collect an "edited" and "published" piece of graphing work from each. Lucy uses the phrase "fix up and fancy up" when she introduces the idea of publication to young children. I found myself using the same phrasing today, telling the class that they would be choosing one of the graphs they had created over the past few weeks to "fix up and fancy up." I modelled how I might do this and shared a checklist for top quality work: neat, periods and question marks, upper and lowercase letters, vowels, at least one conclusion for first graders and at least three conclusions for second graders. Students spent the period copying over their graphs, fixing up the writing, and adding new conclusions before mounting them on large construction paper to be hung in the hallway.
Wednesday, October 13, 2010
Line Plots

Our second graders are supposed to learn about line plots, while first graders are simply supposed to master bar graphs. Today's mini-lesson introduced the idea of the line plot to the whole group-- a graph where the choices are numbers. I modelled this by surveying students about how many teeth they had lost. Creating line plots were then required of second graders and offered as a choice for first graders during our ongoing graphing workshop.
Tuesday, October 12, 2010
Multiple Choice Graphing

Up until now we've been asking questions with two choices--Would you rather do this OR this? Would you rather have this or that? Today we made graphs where survey respondants were given more than one choice-- which is your favorite color: red, orange, yellow, green, blue, or purple? The conclusions drawn from these graphs include many more possibilities-- for example, more people like red than yellow, but fewer people like red than blue. After modelling this for students and creating one together, we continued with our graphing workshop and those who were ready to start a new graph created one with multiple choices.
Monday, October 11, 2010
Sideways Graphing

Blocks can be stacked vertically. They can also be stacked horizontally. So can bar graphs. Today we continued to develop survey questions, collect data in the form of a bar graph, and write down conclusions drawn from the data, but instead of working vertically, we turned our graphs sideways.
Where's the differentiation here? I've been a bit concerned about that all this past week. Today I'm worrying less because I could see all of the kids busily engaged in their work. When a task isn't appropriate, I usually have off-task behavior. When a task is suitable for everyone, everyone stays focused. This is a somewhat open-ended task, which allows students to set their own pace and the writing about conclusions can be done at a number of different levels.
Friday, October 8, 2010
Drawing Conclusions

Thursday, October 7, 2010
Bar Graphs
And finally... the kids each made their own graphs. They thought up a survey question, asked others, and recorded the results.
Wednesday, October 6, 2010
Real Graphs

Today we moved from Venn Diagrams into graphing. I began again with the large masking tape Venn Diagram on the floor, telling students that we would sort ourselves once more and this time we would also count to see which category had more people in it. I asked students to stand in circle A if they would rather be a tiger or in circle B if they would rather be a dolphin. Because they had to choose which they would rather be, no one needed to stand in the "both" overlap. Then I began to count how many kids were in each group and feigned difficulty, double counting and losing track as I went. Since Venn Diagrams are great for sorting, but not so great for comparing numbers, I dramatized thinking of a better solution-- a graph. So I ripped up the masking tape circles and created two masking tape lines, this time asking students to stand in one line if they would rather be a tiger and in the other if they would rather be a dolphin. Again, I dramatized trying to count the groups, having a much easier time finding out that in this class, more people would rather be a dolphin.
Just as we moved from the concrete to the abstract with "Not Boxes" and Venn Diagrams, I tried to move from concrete to abstract graphing in a series of small steps. After making human graphs, we worked together to make a picto-graph with each child drawing a picture of the animal they would prefer to be-- this time, an eagle or a whale.
Tuesday, October 5, 2010
More Venn Diagrams

Just as we sorted objects, then people, then names into "not boxes," we moved from sorting objects to sorting people and then names into Venn Diagrams. Today I made a giant Venn Diagram on the floor with masking tape and we sorted children into it, followed by sorting of name cards, and finally created a Venn Diagram together on chart paper. Then each child came up with their own question and surveyed their peers, asking their friends to sign their Venn Diagrams in the appropriate spot. We used the same procedures as when students created their own "Not Box" surveys. Afterwards students took turns sitting in the Mathematician's Chair and describing their data using the words "greatest," "least," "most," "more," and "less." For homework everyone surveyed their family members using a Venn Diagram.
Monday, October 4, 2010
Venn Diagrams
Our work with sorting into "Not Boxes" last week involved sorting by one attribute at a time. We sorted buttons that had holes from buttons that did not have holes, lids with stickers from lids without stickers, etc. Today we began sorting using two attributes and introduced Venn Diagrams to accommodate this more complex sorting.
I modelled using sorting hoops on the floor-- trying to put lids with stickers in one hoop ad lids with writing in another hoop, only to bump up against the reality that some lids had both stickers and writing and therefore belonged in both hoops, leading then to the creation of a Venn Diagram with overlapping hoops.
Then with the kids' help, we sorted green lids and lids with screw tops. This time we recorded the sorting on chart paper. Then they worked independently on sorting lids and recording their own work on paper. As with the "not box" work, the sorting is done on Venn Diagrams copied onto yellow paper which I refer to as "mats" and recorded on Venn Diagrams copied on white paper which I call "recording sheets." The "recording sheets" have lines for writing on a name and date as well as a label for each circle.
Friday, October 1, 2010
Tally Charts

Another step towards abstraction today... We surveyed the class about things that they like and do not like, sorting their answers into "Not Boxes," but instead of recording names, we recorded with tally marks. I modelled this process to start, then the class created a survey together on chart paper, then they each created their own survey and tallied the answers.
A few rules set up and enforced today will allow us to continue surveying in an orderly manner over the next couple of weeks as we continue into learning about graphing.
Rule Number 1: You do your thinking, planning, and question writing at your own table spot.
Rule Number 2: When you are done, you may go to the meeting area, where you may ask others your
question and then record your data. You are not allowed to bother those who are still working at their table spots. You may only question those who are in the meeting area.
Rule Number 3: You must ask a full question. Don't just go up to another child and say "Dogs or not dogs?" It isn't clear what you want to know. Ask them "Do you like dogs or not?" "Do you have a dog or not?" "Would you like to be a dog or not?"
We had students model, discuss, and practice each of these rules, and I provided a lot of reminders and did a lot of reinforcing during the workshop period. Hopefully, now we'll be set up for good habits moving forward!
Thursday, September 30, 2010
Sorting People

We began our sorting and graphing work by sorting manipulable objects--buttons and lids. Then we moved onto recording those sortings on paper, stepping from the concrete to the abstract. Our next step today was to sort people and their preferences.
Again, we used "Not Boxes," and moved from the concrete to the abstract. I outlined large sorting boxes on the floor of our meeting area in masking tape. Then sorted four or five children at a time into the boxes, first by looking at obvious physical traits (long pants/not long pants, wearing blue/not wearing blue), then by personal preferences (Do you like spaghetti/not like spaghetti? Do you like swimming/do you not like swimming?) After everyone had a turn, we repeated this process in a slightly more abstract manner by sorting name cards into the giant boxes. Another step towards abstraction was writing children's names onto a set of boxes drawn on chart paper. For homework tonight, children will sort the names of their family members into boxes after asking the question "Do you like pizza?"
Was this lesson differentiated? Not at first glance. It was a whole group lesson without being particularly open-ended. Tomorrow, as students do some of their own surveying, there will be more opportunity for students to modify the lesson to suit their own needs. I'll have to think more about this one. Perhaps there is something more that I could do with questioning throughout-- planning out questions ahead of time tiered for different levels. Let me know if you have ideas!
Wednesday, September 29, 2010
NOT Box Recording

Graphing is all about taking the concrete--some actual things, actual events, actual people--and rendering a more abstract representation of a situation. Children in the primary grades (and perhaps learners of any age) must work first with the concrete--the actual buttons, or lids, or blocks, or what-have-you-- before attempting the more abstract--the recording on paper. Yesterday we just sorted the objects. Some created very obvious sorts, some made the task more challenging by attending to unusual details. Today we took the next step, recording these sortings on paper.
Again, I began by modeling a sort and this time modelled recording my work on chart paper with pictures and words. Then I created a sort and asked students to help me label my sorting rule. Again, we had an open-ended workshop period with students creating as many sorts as they had time for, trading zipper baggies of buttons and lids for new ones when they were ready.
Tuesday, September 28, 2010
NOT box sorting

Today as we launched our next math unit (sorting and graphing), I found myself wondering again about the validity of spending instructional time on what seem like simple skills. The new common core standards ask kindergarteners to "classify objects in categories," while first graders are supposed to "organize data in up to three categories" and second graders are supposed to create graphs. I feel like these are fair goals for each grade level, but I also know that while classifying objects sounds simple, it can actually be incredibly complex. When given a handful of buttons to sort, many first graders will create two piles: the thin buttons and the buttons with holes. When faced with thin buttons that also have holes, they may be completely stymied.
Sorting buttons is an open-ended task that I find to be appropriate for both my first- and second-graders. Up until now, sorting has been considered a preliminary skill for graphing work and again, is a task that will undoubtedly help them meet more complex goals. I have decided to carry on with this work, even though the new standards would suggest it is more appropriate for younger students.
Earlier this week, Organized Chaos posted about the complexity of counting to 100-- a seemingly simple task, but one that is not easy for kindergarteners to master. She expresses frustration that more and more standards are being added to the list of kindegarten responsibilities, some of which are less than developmentally appropriate. My frustration as we work with the new common core is that fewer standards sounds great, but cutting out simpler precursor skills only makes the learning more difficult. Mastering fewer standards does not mean teaching fewer lessons.
Today's lesson is based on an Investigations lesson with sorting boxes called "Not Boxes." Students need to identify an attribute and sort items into those that have the attribute and those that don't. Any objects could be used for sorting, but today we used buttons and lids. I began by modelling this sorting, then sorting again and challenging the class to figure out the rule I used for sorting. Then I gave each child a paper sorting mat and asked them to sort a baggie full of buttons into a "Not Box" in any way that they saw fit. As students sorted, I circulated around the room and tried to guess the sorting rules they were using. Could I always guess? Sometimes, yes, and sometimes, no. Many times I needed to coach a re-sort, even for second graders.
Monday, September 27, 2010
Staircase Patterns

There is a lesson in the first grade Investigations in Number, Data, and Space (Dale Seymour Publications, 1995) curriculum exploring the idea of a "staircase pattern," a pattern in which quantities grow. This lesson is based on the Eric Carle book, Rooster's Off to See the World in which a rooster is joined in his travels by two cats, three frogs, four turtles, and five fish. Carle includes a graphic on each page showing the number of animals in the group arranged in a staircase-type design. The Investigations lesson suggests that the teacher begin reading-aloud the book, then stop partway through so that students can make predictions about what will come next by extending the pattern.  This is a nice example of an open-ended task which can accomodate a range of learners, but in my multi-age class, I generally need to stretch the task a bit more for the second-graders.


Today we started with a read-aloud of Phyllis Root's One Duck Stuck . Obviously, Carle's book is the best book for this lesson since he includes the "staircase graphic" but many other books play with the same pattern. Because I teach this lesson each year, and some of my students will have had the lesson the previous year, I alternate my read-aloud book. One Duck Stuck is similar to Rooster's Off to See the World in that an increasing number of animals continue to join the group on each page.
After a brief discussion of the staircase pattern in the book:
What might happen next?
Is this a pattern?
How is it a pattern?
What is the pattern unit?
Could we translate this pattern into letters?
Could we translate this pattern into numbers?
Could we translate this pattern into pictures?
Could we translate this pattern into snap cubes?
I asked the class to make and record their own staircase patterns. First graders generally made simple counting patterns, but I asked many of the second graders to try to make staircases that skip counted.
During our share session at the end of the workshop period the group became very interested in the idea of making a really big snap cube staircase and worked together as a class to make the staircase you see above. This led into counting how many cubes made up the total staircase. (We used 276 cubes!) Tomorrow I'd like to push students to investigate how many cubes make up the staircase patterns they created individually.
I also have thought that it would be neat to make some kind of large staircase pattern to display in the stairwell of our school, but I will need to think more about how to carry that out...
Sunday, September 26, 2010
Pattern Necklaces

I have yet to meet the child that isn't drawn to jewelry. Boys, girls, doesn't matter. If it sparkles, they love it. So today we made pattern necklaces. This was an open-ended activity with some parameters set up to hold children accountable for math work.
We made our necklaces out of very simple materials-- plastic pony beads and elastic cording


Rules were as follows:
All necklaces must have a pattern.
Before you are allowed to touch the beads, you must make a plan.
The plan must include a colored drawing with the pattern unit circled and a translation into letters underneath.
Second grade patterns needed to be more complex than a simple "AB" pattern.
Friday, September 24, 2010
Where Did Patterns Go? An old curricular cornerstone is missing from the new common core standards.

So patterns don't actually appear to be part of the new common core standards. I'm loving the idea that the common core is more streamlined than our old standards, but not exactly sure what to make of the fact that old curriculum cornerstones are apparently no longer relevant.
To be fair, number patterns do seem to be still seem to be something that needs addressing, but basic identification of pattern, translating a pattern into letters, identifying the pattern unit, and extending a pattern are apparently no longer important skills. Were they important before? I'm not sure... They were definitely tested skills.
When I noticed that estimation was missing from the common core, I decided to go ahead with activities that required students to make estimates anyway, working on the assumption that students' overall number sense and therefore other common core math skills would be developed in the context of that activity as well. (See an example here.) When I noticed that visualizing numbers, a la "quick images" was not part of the common core, I decided that the activities were still worthwhile and could be justified by the standards about understanding place value in base ten. These missing elements seemed to support the common core standards that remained. Estimation and visualization are also skills that I imagine students will use in their own lives. I feel justified in continuing to teach these lessons.
But what about patterns? I'm still torn. Are these skills that students will have to use in life? Are they skills that underlie other math lessons. For years I feel that teachers have been told that math is "the study of patterns." --Something I believe was articulated by the famous mathematician A. N. Whitehead. Is this truly so, or is it only a handy justification?
I have noticed over the years that some children seem to have an innate ability to recognize and work with patterns, be they colors, letters, shapes, numbers, or what-have-you, while others truly struggle with pattern activities. Is this ability correlated with ability in mathematics later in school?
For now I suppose, I'll continue on with my pattern lessons, but I'd love to know what others think. Should I drop these lessons and develop others more focused on number. Maybe I should keep the lessons, but teach them outside of my daily math block?
Tuesday, September 21, 2010
Pattern Work

Math choice today with the gang busy puzzling over patterns, while I pulled small groups at the round table. The choices: making and recording snap cube patterns (also circling the pattern units and translating them into letters) and completing cube pattern puzzles (recreating a cube pattern on a mat board and then extending it). At the back table we played "What comes next?" with first graders deciding on a colored cube that would come next in my snap cube pattern and with second graders drawing figures to complete illustrated patterns.
Friday, September 17, 2010
Scoring "How Many of Each?" Problems on a Rubric

Today we worked on "How Many of Each?" Problems again. This time, though, we got a bit more abstract, so I began by telling the class that we'd be working with made-up stories.
I also introduced a very simple scoring rubric. Just because a task is open-ended doesn't mean there shouldn't be some performance standards.
Here's my deal: For every accurate answer a student provides, I mark a star on the paper. Some students will work very hard to get that one star. Other students will wind up with ten or twelve stars because they have found many possibly combinations. Additionally, for every way in which they show me their thinking, I add a smiley face. If there is a picture, it gets a smiley face. If there are words, it gets a smiley face. If there are numbers, it gets a smiley face. If there is a chart, it gets a smiley face. Obviously, four smiley faces might indicate a bit of overkill, but I'd rather have a student over-explain than under-explain as they are beginning to develop the habits they'll take into testing situations.
And here are some of the stories we worked on today:
- There were 10 pets. Some are dogs and some are cats. How many of each could I have?
- There were 12 animals. Some are cows and some are pigs. How many of each could I have?
- There were 13 fruits. Some are apples and some are pears. How many of each could I have?
- There were 14 crayons. Some are red and some are blue. How many of each could I have?
- There were 16 toys. Some are cars and some are boats. How many of each could I have?
- I have 20 cents in nickles and pennies. How many of each could I have?
- I have 25 cents in dimes, nickles, and pennies. How many of each could I have?
Thursday, September 16, 2010
Introducing "How Many of Each?" Problems

"I have 6 toy ducks hidden under this box. Some are green and some are red. How many of each could I have?"
"How many of each?" problems were some of the first open-ended problems that I used in the classroom, prompting me to feel that it is possible to differentiate math instruction without driving myself crazy teaching multiple lessons or juggling small groups. I believe that they are a great way to challenge students at a variety of levels within the same context, and I have posted more about my experiences with "How many of each?" Problems here.)
"How many of each?" problems are also some of the first open-ended problems that I introduce to students each school year. I expect, of course, that students will bring a wide range of understanding to the table. First graders who are only a few months out of kindergarten have limited experiences recording their thinking on paper. Second graders who were in my class last year understand a lot more about what I expect in terms of paper work and their number sense is usually much more advanced. In order to help all of my students find success on our first day working with these problems, I begin with a very concrete example. (More abstract problems can come over the next few days.)
In the school basement a few years back I discovered a stash of toy rubber ducks in a variety of colors-- I find them to be the perfect concrete context for this lesson. Are rubber ducks required? No, of course not. Teddy bear counters, bottle tops, crayons... if it comes in a variety of colors, it would probably work well.
I begin by showing students the ducks and we do a little counting. Then students hide their eyes and I put some ducks under a box. They guess how many are under the box and we check and count. Students hide their eyes again and this time I hide 5 ducks-- 2 red, 3 green. Now I ask the first "How many of each?" problem-- "There are five ducks under this box. Some are red and some are green. How many of each could I have?" As students suggest combinations we use the extra ducks to show possibilities, and to stay organized we keep each combination on its own piece of construction paper. Once we have all the possible combinations covered, we have a big reveal complete with drum roll.
And just as there is a range in the group of mathematical capability, there is a range of social/emotional maturity. It is seemingly inevitable that one of my youngest will crow that he was "right" about what was under the box and another will tear up a bit because he suggested a combination other than the one I had hidden. We go on to have a conversation about how there were lots of great ideas about what could have been under the box and how getting the "right" answer was really just lucky.
After all of this opener, we finally get to that open-ended workshop question. The kids close their eyes, I hide 7 ducks, some red and some green, and they are sent off with blank paper to show how many of each there could be.
At first as they work, I circulate, but as students begin to finish, I ask them to check in with me and show me their work. My policy is to say something positive and encouraging... "I like how you drew all the ducks." "I like how you labeled your picture." "I like how you wrote down the numbers." ... and also push them to just a little further... "Could you label your picture?" "Could you add those numbers?" "Could you think of another possibility?" Some students take another piece of paper or two or three or more and staple their pages into a booklet of possibilities.
When the work period is over, we gather once more on the rug. We share some different strategies and answers. We have a final big reveal.
Wednesday, September 15, 2010
Shopping!

Ten years ago when I first started teaching, I came upon some great resources left behind in the classroom by a previous teacher. These included the Box It or Bag It Mathematics : Teachers Resource Guide series (Burk, D., Symonds, P., Snider, A., 1988). A cornerstone activity in this series-- the shopping project--is one that I try to use regularly as well. A shopping project is the ultimate open-ended activity and it works well for a wide range of learners. I've used it with just first graders and I've also used it with wider multi-age spans of first- through fourth-graders.
Here's how it works:
First I collect five or six interesting art elements. Sometimes these are pieces of construction paper cut into different shapes-- red triangles, blue squares, yellow circles, etc. Sometimes these are squares of paper, squares of fabric, squares of foil. I make sure to have lots of each element. Next, I make price tags for each element-- 1 cent, 2 cents, 5 cents, 10 cents, 12 cents. Lastly, I prepare zippered sandwich baggies full of pretend coins for each student. I just put in random handfuls of coins so that each child has plenty of money, I don't bother counting it.
When I introduce the project to the class, I show each material and the price and model the process of developing a piece of artwork and purchasing the different elements. Here I think aloud as I create a shopping list, pay for the pieces, and arrange them on a base piece of construction paper. Then I give each child a big piece of construction paper to use as a base, a bag full of money, and a piece of paper for their own shopping list. I send students off to plan, and as they finish, I open the store for shopping.
The tricky part is keeping the line moving at the store. If you can have help running the store from an assistant or volunteer, all the better!
I find that younger students rely mostly on pennies for shopping, older students are fascinated by getting change back on their purchases (and often misunderstand this process as getting free money). The most advanced students can be challenged to look at finished pieces of artwork and calculate the total cost of each project or compare two projects and determine which one cost more to produce. Some students might be able to handle a budgeting aspect to the project, but I prefer not to include that element because of the social issues that crop up once you introduce scarcity into the classroom. (Again, see this great post by Lori of Camp Creek Blog.)
Tuesday, September 14, 2010
Money Jars

Today's read-aloud, A Chair for My Mother by Vera B. Williams, is about a family that saves up coins in a jar to buy a new soft comfy chair after losing many of their belongings in a fire. We talked about how we might save up coins in a jar and did a little counting of my large demonstration coins in a big plastic jar. Then we compared the total coins in two jars.
Math choices included this worksheet where students filled the jars using coin stamps, totalled the amount of money, and indicated whether jar A or jar B had a greater total by filling in the appropriate circle. This open-ended task allowed students to adjust the amount of money they had to count in simpler or more complex combinations. Younger children stamped only with pennies. Older children counted quarters, dimes, nickles, and pennies.

Monday, September 13, 2010
Introduction to Money

Today we did a little introduction to money-- coin identification, so that over the next few days we can do additional work counting and comparing amounts of money. I started with a whole-class overview on how to identify a penny, nickle, dime, and quarter. I have a set of large demonstration coins, and we examined each coin in turn, discussing features that students noticed. Size and color are obvious markings, but the class was most interested in talking about the presidents featured on each coin and the fact that statue of Abraham Lincoln can be seen sitting inside the Lincoln Memorial on the back of the penny. I actually did not know this about the Lincoln statue until a student told me about it. I'm not really sure how much the other kids actually understood about the idea that you could see a tiny speck that is supposed to be a giant statue in a building that according to another child "looks like a trolley car." Then again, the point of the lesson wasn't in national monuments or presidents, but in learning to identify coins. Attending to these details definitely helped the children differentiate amongst the coins! After our brief discussion, I handed out baggies with one of each coin and asked the children to hold up each coin in turn. They were very successful with this little test. The workshop part of our day included several math choices, one of which was to make your own set of pretend coins out of brown and gray construction paper. Students really got into this activity and many tried to include Abraham Lincoln sitting inside the Lincoln Memorial! This being an open-ended task, there was a range of quality in the coins produced, but I told them I needed to be able to identify the coins they made without being told which was which. Again, in most instances, they were successful.
Saturday, September 11, 2010
The Mathematician's Chair

First it was an Author's Chair... Then it was a Scientist's Chair... Now it is a Mathematician's Chair.
Early on in my teaching I adopted the practice of having a few students share their work at the end of writing workshop time. I saw other teachers using a special "Author's Chair" to keep students' attention focused on the child who was reading. It appeared to make such a difference, that I quickly decided that it would be a helpful tactic in my own classroom.
A few years later, I realized that my students were full of terrific hypotheses and theories during our science lessons, but they were not really terrific about paying attention to what others were saying. A stroke of inspiration hit and our "Author's Chair" became a "Scientist's Chair." Soon students were incredibly excited to share their ideas for the priviledge of sitting in the special chair and the group was much more attentive to those ideas being shared.
Then when our school district's state math test results weren't great, and we teachers sat around together pouring over the data, it became pretty obvious that our students needed to improve their ability to communicate mathematical thinking. The multiple choice scores were fine, but the open-response scores were not so hot. Lots of discussion ensued about how we might do this, but in the end the only real conclusion reached was that we all needed to give our students more practice with open-response questions.
Of course, I didn't rush right back to my classroom and institute daily open-response math journaling as had been recommended. Although I definitely believe open-response questions play an important role in our math classrooms, I don't believe that all math concepts are best taught in this way. Plus, there are only so many hours in the school day, and besides, young first graders don't all have the requisite patience for lots more pencil and paper work.
Then I went to a Math Solutions workshop and got chatting with a third grade teacher from another school who casually mentioned that they'd started asking their students to answer open-response questions orally rather than on paper in order to save time.
Ah-ha. Yes. My students might not be ready to write about math daily, but they could definitely talk about math daily. And so the Mathematician's Chair was born.
Now I try to build in time at the end of each math lesson for the Mathematician's Chair. Here students take turns explaining how they know a number is even or odd, describing the results of a survey, or demonstrating an addition strategy. And just as the chair focused the audience of writers and scientists, it provides a focus for thinking about mathematical ideas.
Friday, September 10, 2010
Visualizing Numbers

"1,2,3, Look at me. Tell me the number that you see."
This was today's refrain as we worked on Quick Images. The Investigations curriculum makes extensive use of this type of activity. Students are briefly shown an arrangement of dots, and they are asked to quickly determine how many dots they were shown. They are not given enough time to count the dots one by one and so they must adopt other strategies, combining small groups, etc., to determine the amount. These activities are supposed to recur regularly throughout the school year with dot arrangements that become more complicated over time.
I have sometimes wondered about the usefulness of this activity. It isn't an activity that occurs in traditional math curriculums, and I didn't spy anything in the common core standards about visualizing numbers. Then I read Subitizing: What Is It? Why Teach It? by Douglas H. Clements which details the various theories and research supporting Quick Images activities and makes a convincing case for providing regular opportunities for students to practice recognizing and visualizing number groups. It would seem that recognizing number groups is a skill underlying many of the skills required in the common core.
There are a few suggestions that Clements makes that I'd like to work on applying in the classroom. The first is to include quick recognition of auditory or kinesthetic numbers... how many taps? how many dings? The second is to work on recognizing numbers in different formats like the "Tens Frame." I've been using the tens frame pretty extensively since it is prominently featured in the Scott Foresman curriculum, but today I introduced it to students for the first time using Quick Images.
I worked with small groups at the round table on quick images-- youngers were identifying numbers on a tens frame; olders were identifying addition sums on a tens frame. Meanwhile a new math choice activity was working with dominoes, matching numbers to create a domino path.
Thursday, September 9, 2010
Even and Odd

Even and Odd... a pesky concept...
It's so abstract that I really like to ground it in a meaningful context. For the past few days we've begun to do some serious partner work around here-- playing the math card games War and Double War , reading with partners, talking to our "circle partners" during read-alouds, etc. Pairing up students is a natural way to consider the concepts of even and odd. If there are an even number of students, everyone will have a partner. If there are an odd number of students, someone will be leftover and need to join a pair, making a group of three. Today we began to work with this concept, but we can come back to it regularly during our morning attendance routine.
Here is the open-ended problem-solving bit of work that I asked the class to work on today:
"There are an odd number of children in Mr. Brown's class. How many children might there be in the class?"
Most of the younger children found an answer by drawing pairs of people and then counting them up. Those who were a little more advanced found multiple answers. Many of the older children simply gave me a list of odd numbers.
A few students went on to more complex questions like: "Mr. Brown's class has an odd number of children. Ms. Green's class has an even number of children. When the two classes get together, will there be an odd number or an even number of children? Show your thinking in pictures, numbers, and words."
Wednesday, September 8, 2010
Comparing Capacity

Today's goal-- work on comparing volumes and in the process practice counting and writing numbers. I filled a giant plastic bin with as many different sizes and shapes of empty containers as I could gather. I labeled each container A through Z. (Multiples of a particular size/shape were labeled with the same letter.) Then I challenged the class to determine which of a pair of containers was larger. We discussed various possibilities for determining a container's volume and settled on filling the containers with various math manipulatives and comparing total capacity. Then students set to work. Was this lesson actually differentiated? I'm not certain, but if I were to try to make the case that it is, I'd label it an open-ended problem-solving activity. Because students chose for themselves which containers to compare and chose for themselves which math manipulatives to measure with, each child adjusted the level of counting and comparing difficulty for themselves.
Subscribe to:
Posts (Atom)