
If these are the conclusions, can you figure out what this graph looks like?
Today I decided to try a little problem-solving extension with the class... an extra assessment of sorts, I suppose. Even though all of the children have demonstrated their abilities to create surveys and bar graphs, drawing conclusions from the data, I know that our students don't always do well on the data and graphing sections of our state tests. When we, teachers, looked at these questions recently, it was quite clear that an even higher level of thinking is required. Students are asked to match data with a graph or infer conclusions, so it occured to me that I might ask my students to work backwards from conclusion to graph instead of from graph to conclusions. I wrote up a set of conclusions for an imaginary graph and asked my first and second graders to make me the graph.
Most students made this graph without too much difficulty:

Those that had trouble, clearly had different reasons for it, which can be seen in their work.
This student simply colored the wrong number of blocks:
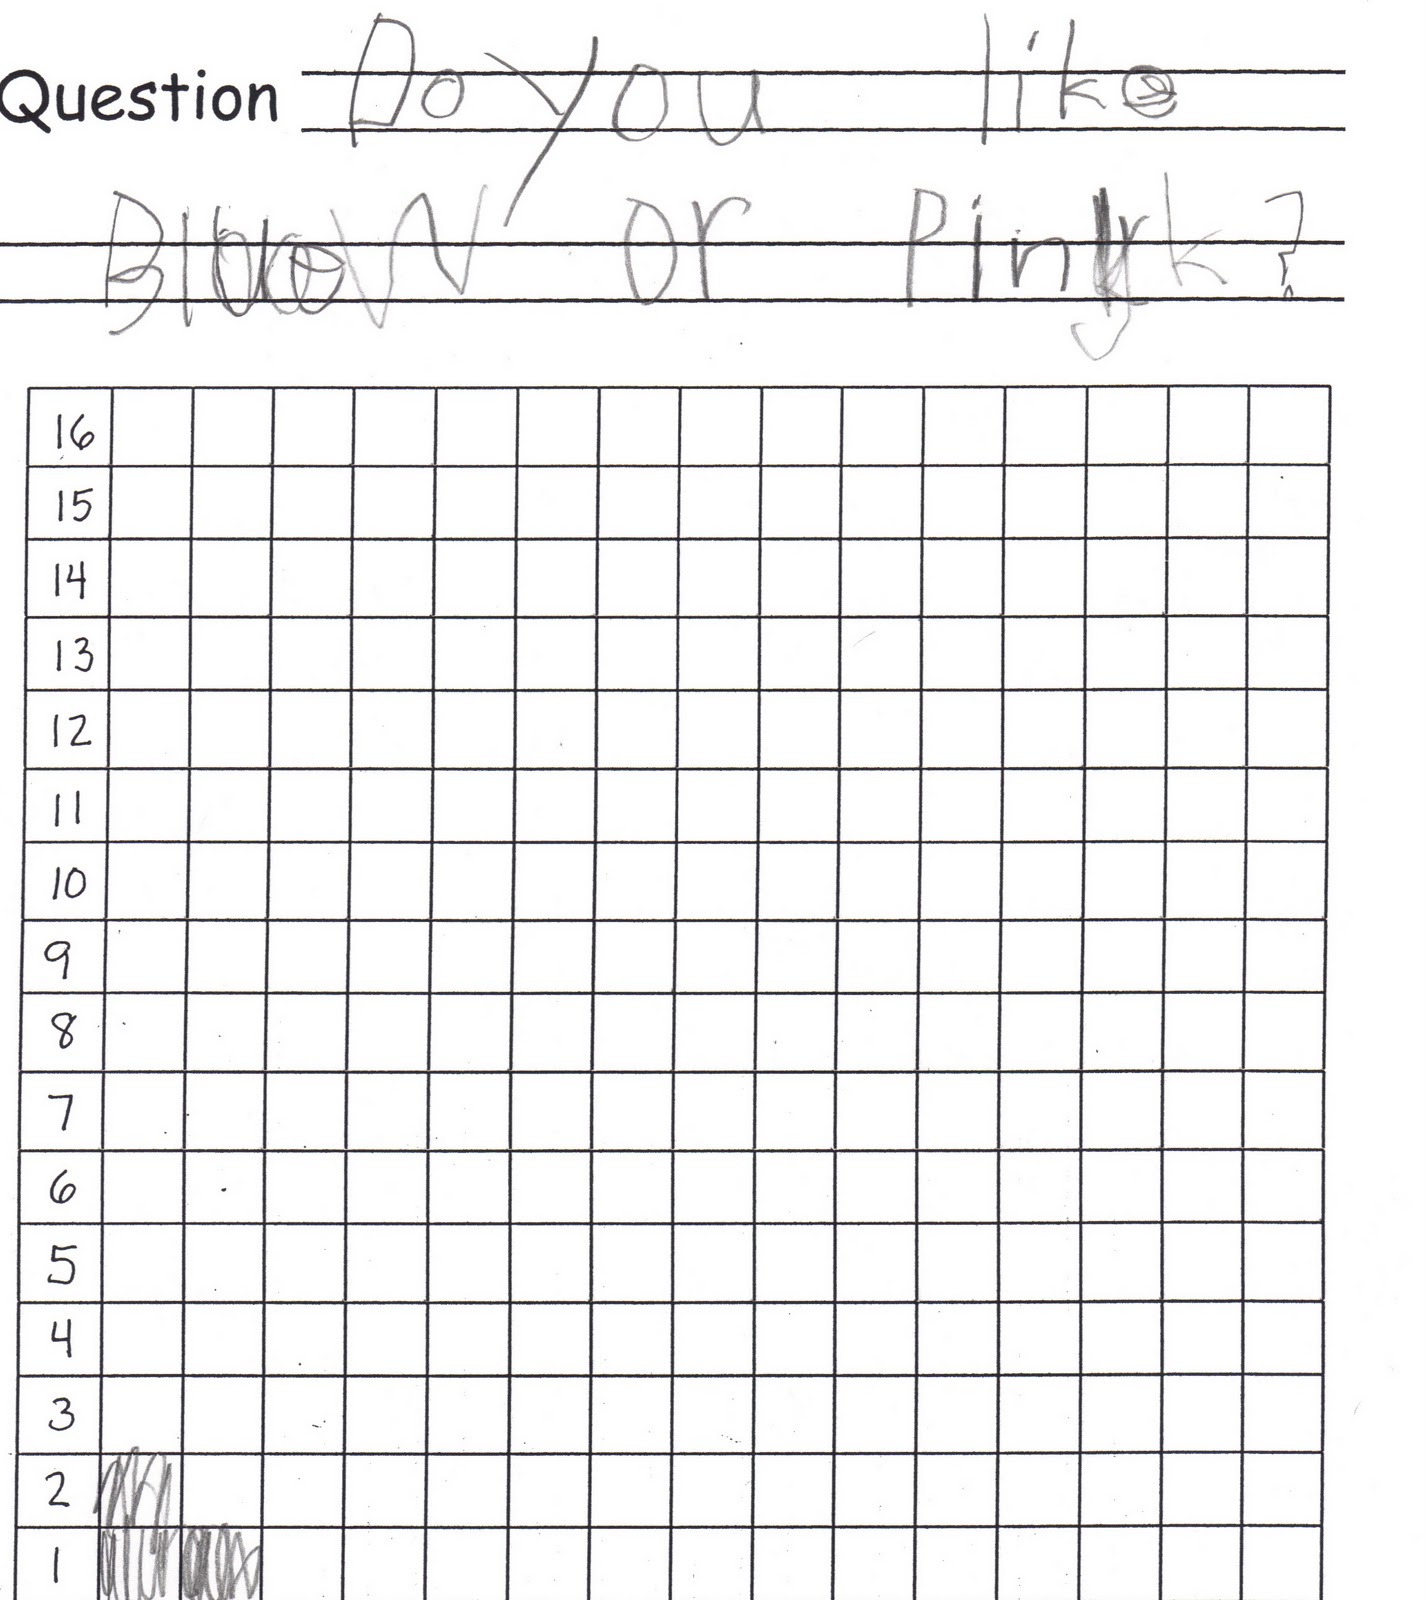
This student misunderstood the task and invented a similar graph to the one indicated. (His reads "Do you like pink or purple?"):


Was this task differentiated? No. Maybe next time I'll try to create a few more of these tasks with a range of difficulty. Students could work on more difficult challenges after finishing simpler ones.
Some other ideas I have for imaginary conclusions:
--Less people wanted to be a goose.
--Most people had 6.
--1 more person liked red than green.
--Equal numbers of people chose dogs and cats.
--Everyone liked it.
--More people liked red. 3 people liked red. 2 less people liked green.
No comments:
Post a Comment