The first graders have done pretty well working independently. They have been focused and diligent in their work and for the most part, successful in solving the problems they've been given. This is a big improvement over years past, and I credit that to the fact that the worksheets they're working on are ones they can actually read. In the past, I've given them worksheets from the Scott Foresman-Addison Wesley math curriculum
Friday, October 22, 2010
Beginning Readers CAN Work Independently
Again, today, the first grade crew worked independently on combining story problems, while the second graders worked with me on missing addend combining stories.
The first graders have done pretty well working independently. They have been focused and diligent in their work and for the most part, successful in solving the problems they've been given. This is a big improvement over years past, and I credit that to the fact that the worksheets they're working on are ones they can actually read. In the past, I've given them worksheets from the Scott Foresman-Addison Wesley math curriculum . These are perfectly fine worksheets to do together with students, but are difficult for students to do independently because beginning of the year first-graders often can't read the stories. They are also often confused or distracted by the decorative edgings and little characters featured on the pages. Last year I tried using problems from the Read It! Draw It! Solve It!
 series which are geared specifically for beginning readers and I had a much better expereience with student independence. Since the kids clearly did better work when they knew exactly what the stories said, I wrote up my own set of worksheets with very simple stories and text using a very simple format. If I could figure out how to attach these documents here, I would, but I don't know a way to do that. If you'd like to have copies, email me at doingdifferentiatedmath@gmail.com and I will send them to you.
The first graders have done pretty well working independently. They have been focused and diligent in their work and for the most part, successful in solving the problems they've been given. This is a big improvement over years past, and I credit that to the fact that the worksheets they're working on are ones they can actually read. In the past, I've given them worksheets from the Scott Foresman-Addison Wesley math curriculum
Thursday, October 21, 2010
Extending Work on Combining Problems
For the past few days, I've really focused instruction on the first graders who are just beginning to work on addition stories. Now that they have a pretty solid grasp on what is expected of them when it comes to solving and recording a solution for a combining problem, I was able to assign this group independent work and focus my instructional efforts on the second graders who were ready to take things a little further.
The older group is totally fluent with basic combining stories (i.e. "There were 3 dogs. 2 more came. How many do are there now?") Today we worked with a more challenging vaersion of this kind of problem-- the missing addend combining story (i.e. "There were 3 dogs. Some more came. Now there are 5. How many more came?")
The older group is totally fluent with basic combining stories (i.e. "There were 3 dogs. 2 more came. How many do are there now?") Today we worked with a more challenging vaersion of this kind of problem-- the missing addend combining story (i.e. "There were 3 dogs. Some more came. Now there are 5. How many more came?")
Wednesday, October 20, 2010
More Write-Your-Own-Problems
More "Stay or Go" work today with addition combining stories. To keep the independent workers interested, I asked them to write their own combining problems related to "Make Way for Ducklings" which we've been reading together as a Big Book. Very sweet results: "There were 7 baby ducks and the mom and dad came back. How many ducks were there?" "Three ducks crossed the street. Then 5 more ducks crossed the street. How many ducks altogether?"
Tuesday, October 19, 2010
Write Your Own Combining Story
Much like yesterday we worked on addition combining stories using the "Stay or Go" format. Those who needed support worked with me on the rug; those who were ready to work independently worked at their table spots. For the independent workers, I have a row of sheets set up along a shelf to move through, but of course, some speed demons do finish all of these. To solve that problem, I added an open-ended worksheet at the end of the row on which students write and solve their own story problem. They can repeat this sheet with infinite variations and keep busy until the end of the period.
Monday, October 18, 2010
Introduction to Combining Problems
Today marks the start of a new unit focused on addition and subtraction concepts. We'll work with addition and subtraction story problems, not only working to come up with answers to questions, but also to relate appropriate number sentences to different types of situations. First graders will work primarily with combining and separating stories, while second graders will also work with comparing stories. In other words, we'll work with stories where I had some and got more and want to know how many I have now and stories where I had some, but lost some and want to know how many I have now. We'll also work with stories where I had some and got more or lost some and I'm wondering how many more I got or lost and stories where I had some and you had some and I'd like to know how many more one of us has compared to the other.
This is new material for the younger children, but familiar territory for the older children, although it has been a while since they've done this work, so a bit of review is called for. To keep everyone appropriately challenged, the unit is set up as a spiraling-scaffolded unit, making plenty of use of the "stay or go" format.
Here's how today's math period unfolded:
First, a mini-lesson in which we acted out story problems, solved them with cubes, recorded them on chart paper with pictures, words, and numbers. I modelled one, we did another together.
Then, those who were ready (i.e. my second grade crew) took worksheets to their table spots to complete independently, while those who needed more instruction (i.e. the first graders) set up worksheets with clipboards in the meeting area so that we could work together.
As the second graders finished their sheets, they moved on to others laid out along a shelf. When the first graders working with me finished our sheet, the math period ended.
Friday, October 15, 2010
A Graphing Extension

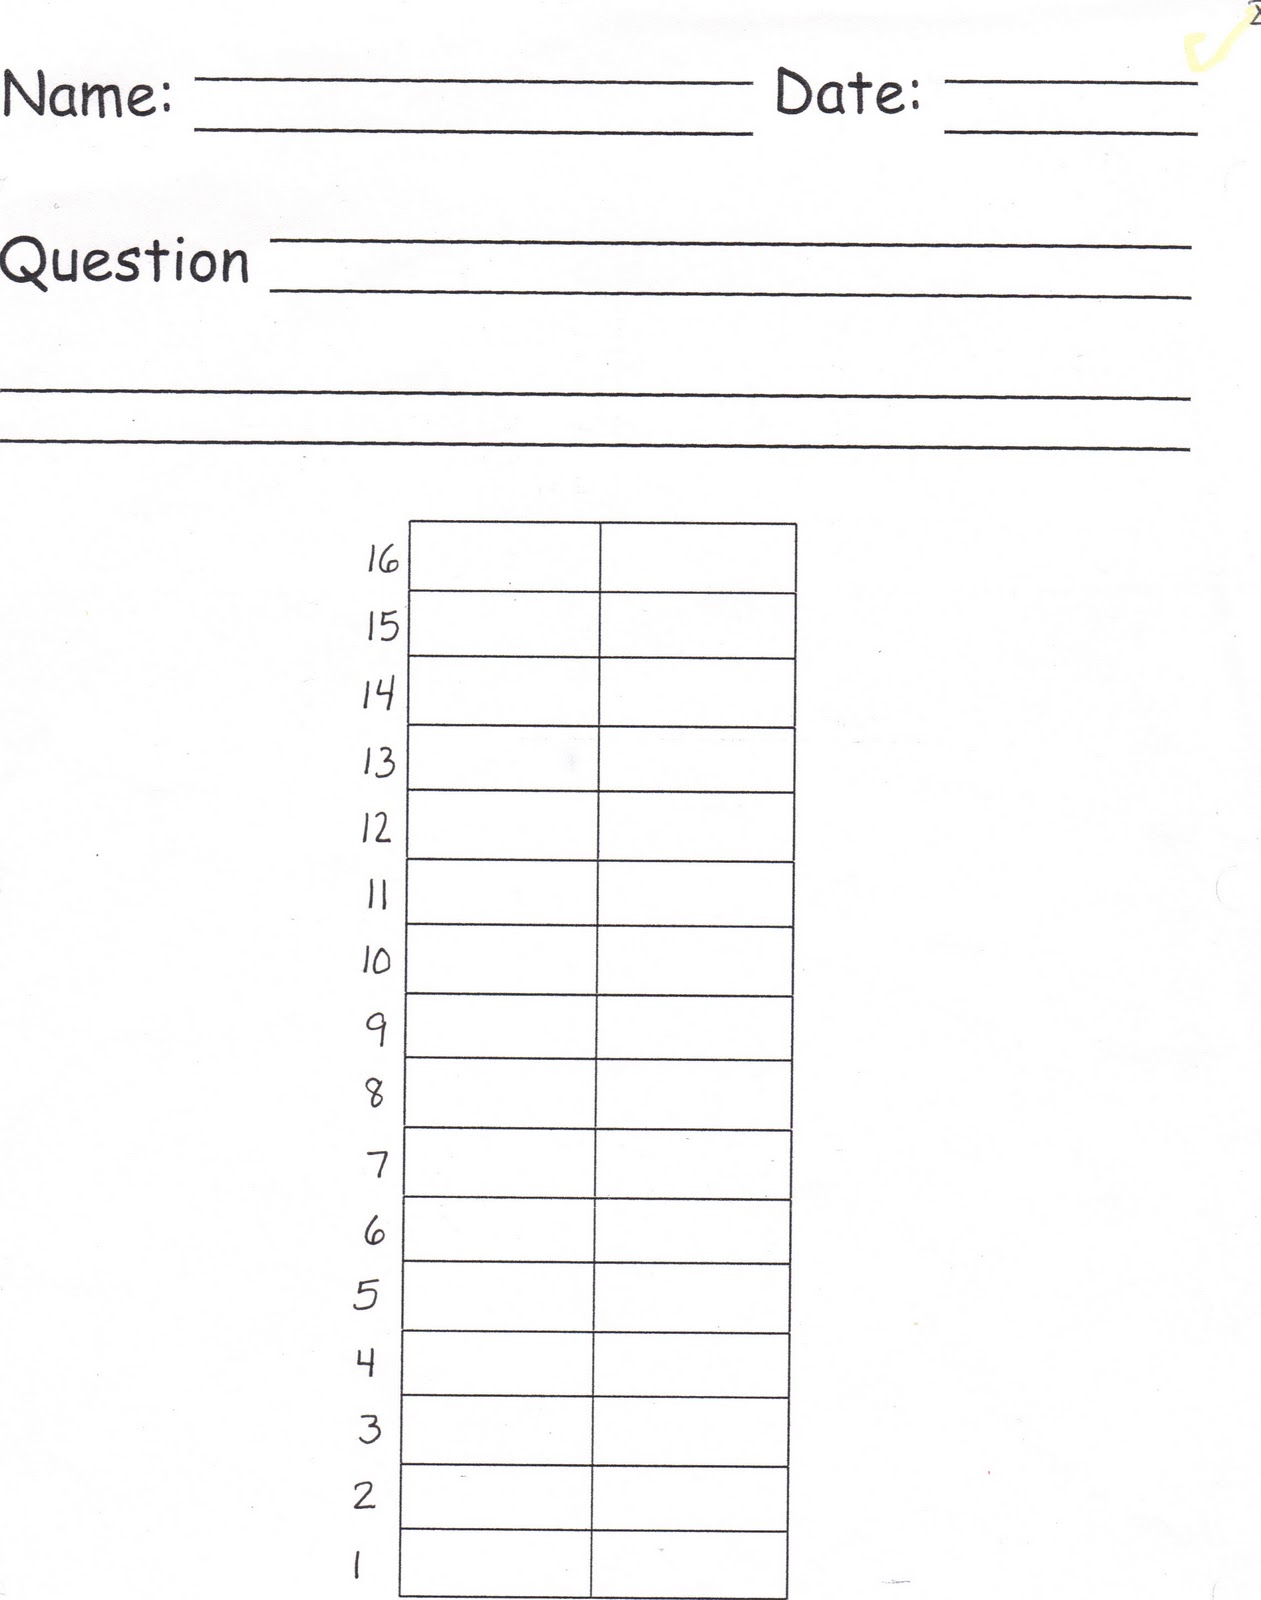
If these are the conclusions, can you figure out what this graph looks like?
Today I decided to try a little problem-solving extension with the class... an extra assessment of sorts, I suppose. Even though all of the children have demonstrated their abilities to create surveys and bar graphs, drawing conclusions from the data, I know that our students don't always do well on the data and graphing sections of our state tests. When we, teachers, looked at these questions recently, it was quite clear that an even higher level of thinking is required. Students are asked to match data with a graph or infer conclusions, so it occured to me that I might ask my students to work backwards from conclusion to graph instead of from graph to conclusions. I wrote up a set of conclusions for an imaginary graph and asked my first and second graders to make me the graph.
Most students made this graph without too much difficulty:

Those that had trouble, clearly had different reasons for it, which can be seen in their work.
This student simply colored the wrong number of blocks:
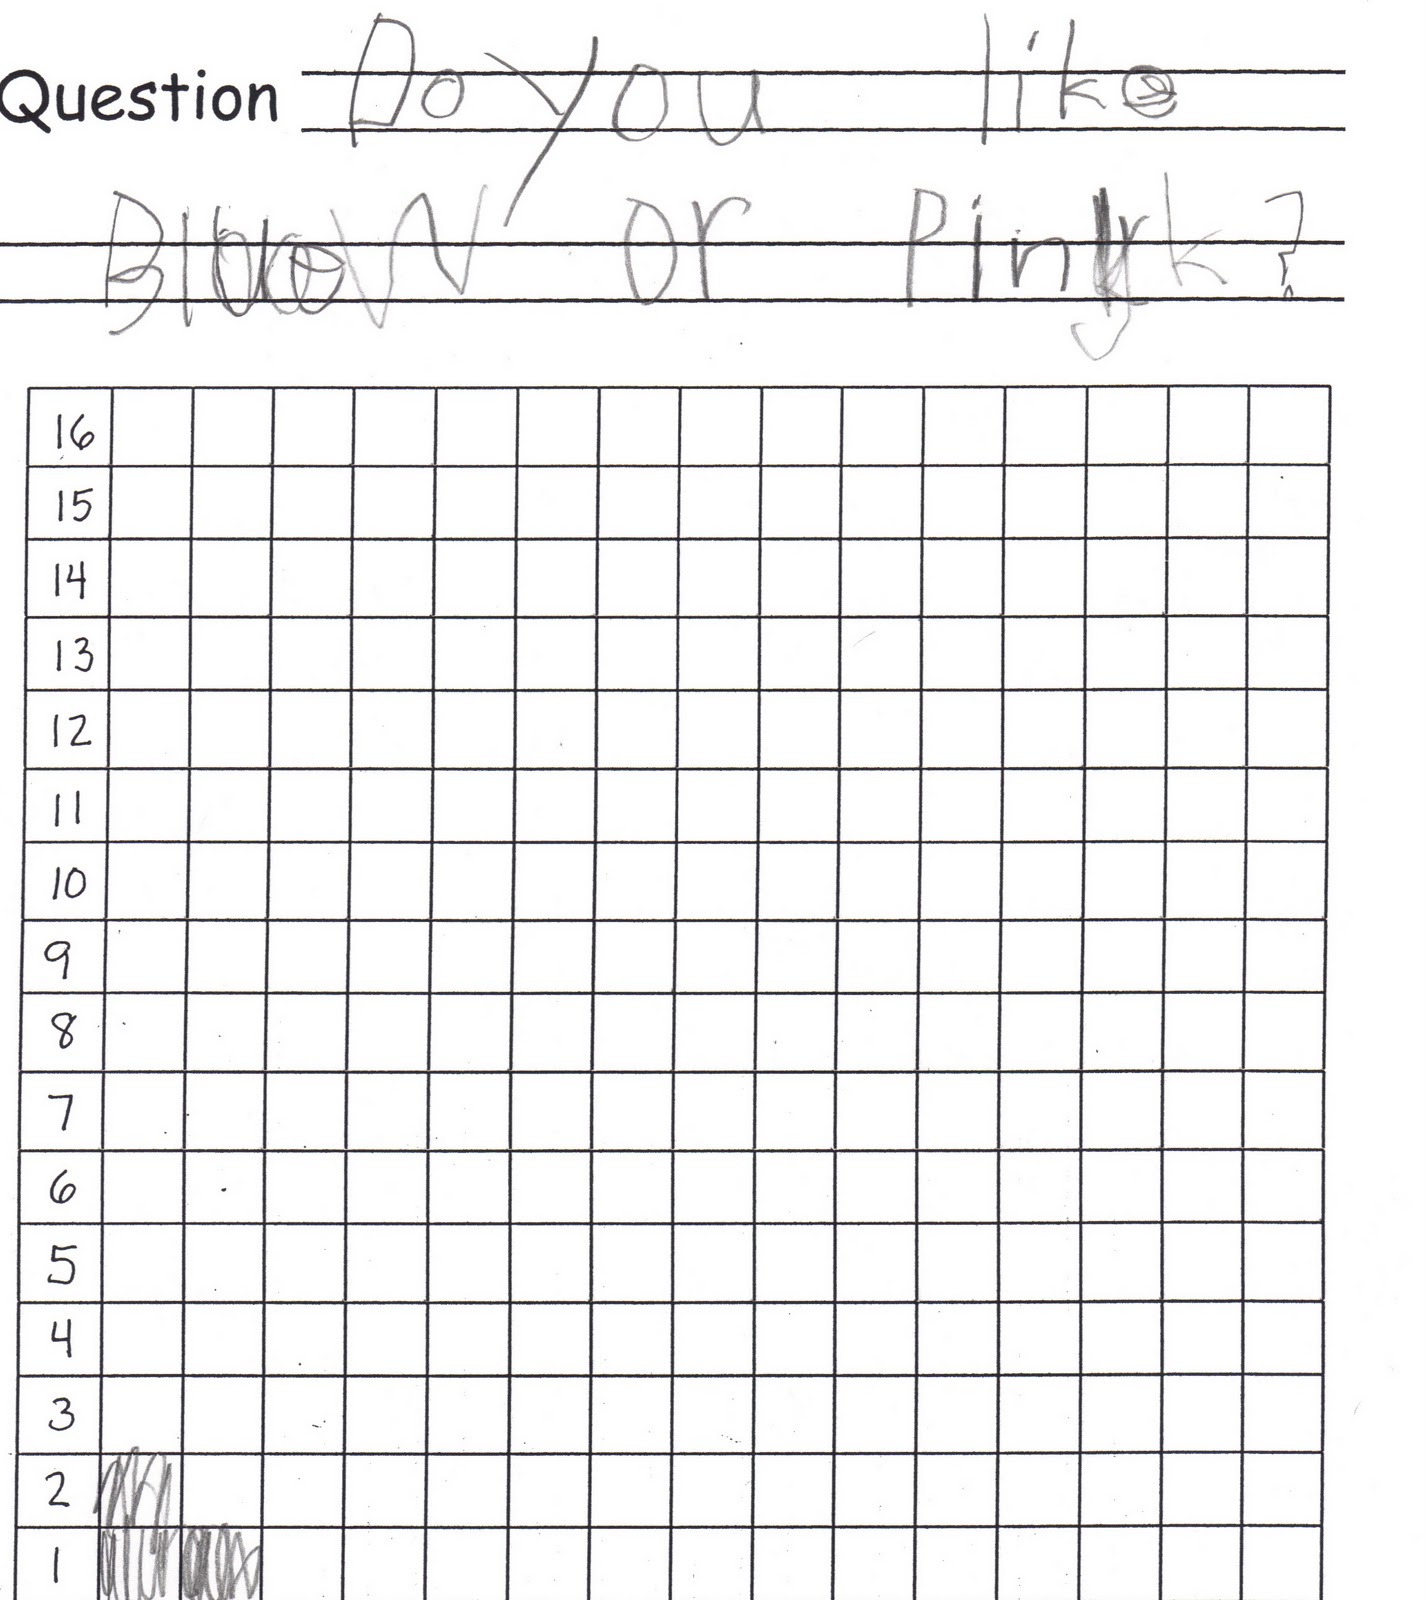
This student misunderstood the task and invented a similar graph to the one indicated. (His reads "Do you like pink or purple?"):


Was this task differentiated? No. Maybe next time I'll try to create a few more of these tasks with a range of difficulty. Students could work on more difficult challenges after finishing simpler ones.
Some other ideas I have for imaginary conclusions:
--Less people wanted to be a goose.
--Most people had 6.
--1 more person liked red than green.
--Equal numbers of people chose dogs and cats.
--Everyone liked it.
--More people liked red. 3 people liked red. 2 less people liked green.
Thursday, October 14, 2010
Graphing Assessment
I've been referring to our math time these past few weeks as "graphing workshop," and I've been thinking of it as very much akin to our "writing workshop." If you are familiar with Lucy Calkins' Writing Workshop model, you'll understand how in order to assess students' learning, I decided to collect an "edited" and "published" piece of graphing work from each. Lucy uses the phrase "fix up and fancy up" when she introduces the idea of publication to young children. I found myself using the same phrasing today, telling the class that they would be choosing one of the graphs they had created over the past few weeks to "fix up and fancy up." I modelled how I might do this and shared a checklist for top quality work: neat, periods and question marks, upper and lowercase letters, vowels, at least one conclusion for first graders and at least three conclusions for second graders. Students spent the period copying over their graphs, fixing up the writing, and adding new conclusions before mounting them on large construction paper to be hung in the hallway.
Wednesday, October 13, 2010
Line Plots

Our second graders are supposed to learn about line plots, while first graders are simply supposed to master bar graphs. Today's mini-lesson introduced the idea of the line plot to the whole group-- a graph where the choices are numbers. I modelled this by surveying students about how many teeth they had lost. Creating line plots were then required of second graders and offered as a choice for first graders during our ongoing graphing workshop.
Tuesday, October 12, 2010
Multiple Choice Graphing

Up until now we've been asking questions with two choices--Would you rather do this OR this? Would you rather have this or that? Today we made graphs where survey respondants were given more than one choice-- which is your favorite color: red, orange, yellow, green, blue, or purple? The conclusions drawn from these graphs include many more possibilities-- for example, more people like red than yellow, but fewer people like red than blue. After modelling this for students and creating one together, we continued with our graphing workshop and those who were ready to start a new graph created one with multiple choices.
Monday, October 11, 2010
Sideways Graphing

Blocks can be stacked vertically. They can also be stacked horizontally. So can bar graphs. Today we continued to develop survey questions, collect data in the form of a bar graph, and write down conclusions drawn from the data, but instead of working vertically, we turned our graphs sideways.
Where's the differentiation here? I've been a bit concerned about that all this past week. Today I'm worrying less because I could see all of the kids busily engaged in their work. When a task isn't appropriate, I usually have off-task behavior. When a task is suitable for everyone, everyone stays focused. This is a somewhat open-ended task, which allows students to set their own pace and the writing about conclusions can be done at a number of different levels.
Friday, October 8, 2010
Drawing Conclusions

Thursday, October 7, 2010
Bar Graphs
And finally... the kids each made their own graphs. They thought up a survey question, asked others, and recorded the results.
Wednesday, October 6, 2010
Real Graphs

Today we moved from Venn Diagrams into graphing. I began again with the large masking tape Venn Diagram on the floor, telling students that we would sort ourselves once more and this time we would also count to see which category had more people in it. I asked students to stand in circle A if they would rather be a tiger or in circle B if they would rather be a dolphin. Because they had to choose which they would rather be, no one needed to stand in the "both" overlap. Then I began to count how many kids were in each group and feigned difficulty, double counting and losing track as I went. Since Venn Diagrams are great for sorting, but not so great for comparing numbers, I dramatized thinking of a better solution-- a graph. So I ripped up the masking tape circles and created two masking tape lines, this time asking students to stand in one line if they would rather be a tiger and in the other if they would rather be a dolphin. Again, I dramatized trying to count the groups, having a much easier time finding out that in this class, more people would rather be a dolphin.
Just as we moved from the concrete to the abstract with "Not Boxes" and Venn Diagrams, I tried to move from concrete to abstract graphing in a series of small steps. After making human graphs, we worked together to make a picto-graph with each child drawing a picture of the animal they would prefer to be-- this time, an eagle or a whale.
Tuesday, October 5, 2010
More Venn Diagrams

Just as we sorted objects, then people, then names into "not boxes," we moved from sorting objects to sorting people and then names into Venn Diagrams. Today I made a giant Venn Diagram on the floor with masking tape and we sorted children into it, followed by sorting of name cards, and finally created a Venn Diagram together on chart paper. Then each child came up with their own question and surveyed their peers, asking their friends to sign their Venn Diagrams in the appropriate spot. We used the same procedures as when students created their own "Not Box" surveys. Afterwards students took turns sitting in the Mathematician's Chair and describing their data using the words "greatest," "least," "most," "more," and "less." For homework everyone surveyed their family members using a Venn Diagram.
Monday, October 4, 2010
Venn Diagrams
Our work with sorting into "Not Boxes" last week involved sorting by one attribute at a time. We sorted buttons that had holes from buttons that did not have holes, lids with stickers from lids without stickers, etc. Today we began sorting using two attributes and introduced Venn Diagrams to accommodate this more complex sorting.
I modelled using sorting hoops on the floor-- trying to put lids with stickers in one hoop ad lids with writing in another hoop, only to bump up against the reality that some lids had both stickers and writing and therefore belonged in both hoops, leading then to the creation of a Venn Diagram with overlapping hoops.
Then with the kids' help, we sorted green lids and lids with screw tops. This time we recorded the sorting on chart paper. Then they worked independently on sorting lids and recording their own work on paper. As with the "not box" work, the sorting is done on Venn Diagrams copied onto yellow paper which I refer to as "mats" and recorded on Venn Diagrams copied on white paper which I call "recording sheets." The "recording sheets" have lines for writing on a name and date as well as a label for each circle.
Friday, October 1, 2010
Tally Charts

Another step towards abstraction today... We surveyed the class about things that they like and do not like, sorting their answers into "Not Boxes," but instead of recording names, we recorded with tally marks. I modelled this process to start, then the class created a survey together on chart paper, then they each created their own survey and tallied the answers.
A few rules set up and enforced today will allow us to continue surveying in an orderly manner over the next couple of weeks as we continue into learning about graphing.
Rule Number 1: You do your thinking, planning, and question writing at your own table spot.
Rule Number 2: When you are done, you may go to the meeting area, where you may ask others your
question and then record your data. You are not allowed to bother those who are still working at their table spots. You may only question those who are in the meeting area.
Rule Number 3: You must ask a full question. Don't just go up to another child and say "Dogs or not dogs?" It isn't clear what you want to know. Ask them "Do you like dogs or not?" "Do you have a dog or not?" "Would you like to be a dog or not?"
We had students model, discuss, and practice each of these rules, and I provided a lot of reminders and did a lot of reinforcing during the workshop period. Hopefully, now we'll be set up for good habits moving forward!
Subscribe to:
Posts (Atom)